Global Reel Platforms Show Distinct Volatility Patterns Tied to Session Durations
Written by Jonas Bauer · Jul 20, 2026
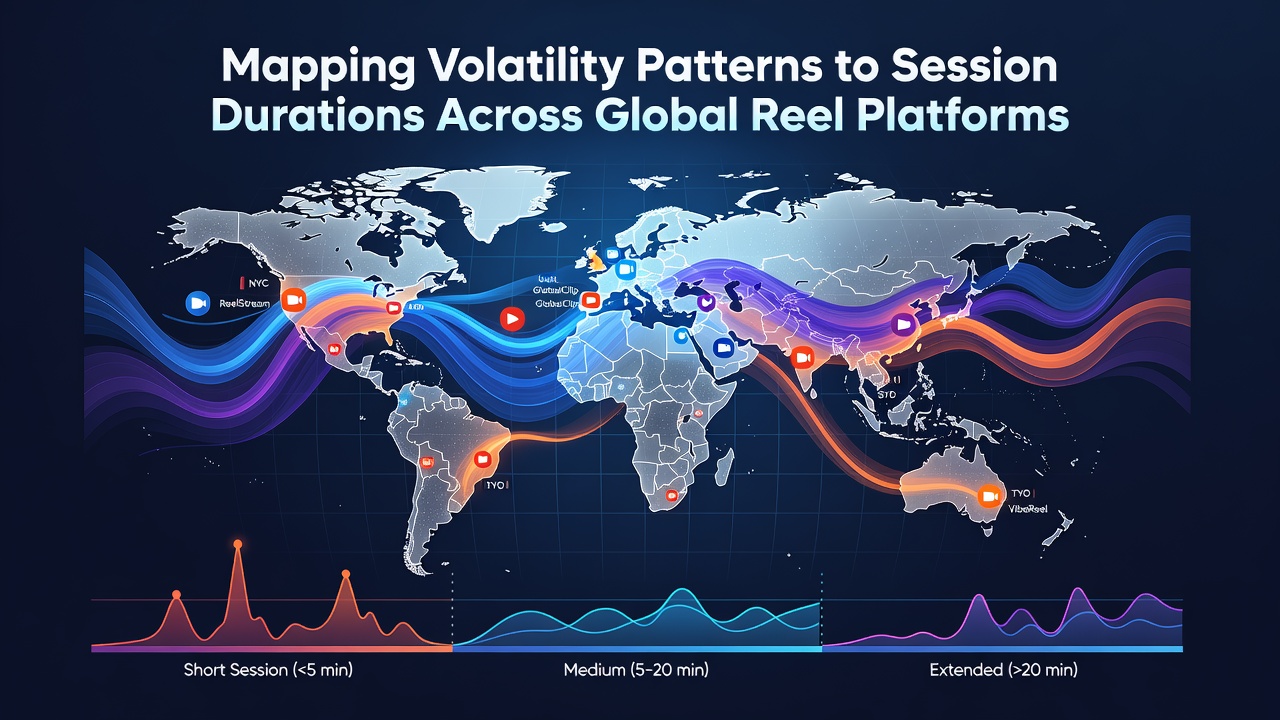
Global Reel Platforms Show Distinct Volatility Patterns Tied to Session Durations
Reel platforms worldwide track volatility metrics that align closely with how long players stay engaged during sessions, and data from multiple markets reveals consistent correlations between risk profiles and playtime lengths. High-volatility titles often produce shorter bursts of activity because players encounter extended dry spells between larger payouts while low-volatility options encourage extended sessions through more frequent smaller returns.
Understanding Volatility Categories on Reel Systems
Volatility classifications divide into low, medium, and high tiers across most global platforms, with each category influencing session behavior in measurable ways. Low-volatility reels deliver regular wins that keep reels spinning for longer periods, whereas high-volatility designs concentrate rewards into infrequent but substantial outcomes that tend to end sessions sooner. Medium-volatility games sit between these extremes and generate mixed session lengths depending on regional player preferences and platform settings.
Platform operators collect session data that maps these volatility levels to duration statistics, and analysts note clear regional differences in how players respond. European markets show preference for medium-volatility options during evening hours, while Asian platforms report stronger engagement with high-volatility titles during shorter daytime windows.
Session Duration Data Across Major Markets
Studies from regulatory bodies in various jurisdictions indicate that average session lengths vary significantly by volatility tier. Low-volatility games average between 45 and 70 minutes per session on many platforms, while high-volatility selections often register 15 to 30 minutes. These patterns hold steady across multiple continents because the underlying payout structures remain consistent regardless of geographic location.
Researchers at institutions tracking gaming behavior have documented how players adjust their time investment based on volatility exposure. One analysis of platform logs revealed that users frequently switch from high-volatility to low-volatility titles mid-session when initial results fall below expectations, extending overall play duration as a result. Such shifts demonstrate how volatility mapping influences real-time decision making on reel networks.
Platform-Specific Patterns and Regional Variations
Different reel platforms implement volatility settings with distinct weighting systems that affect session outcomes. Some networks apply dynamic adjustments based on player history, which can stretch or compress session times depending on the algorithm in use. Others maintain fixed volatility profiles across their catalog, producing more predictable duration trends that operators use for resource planning.
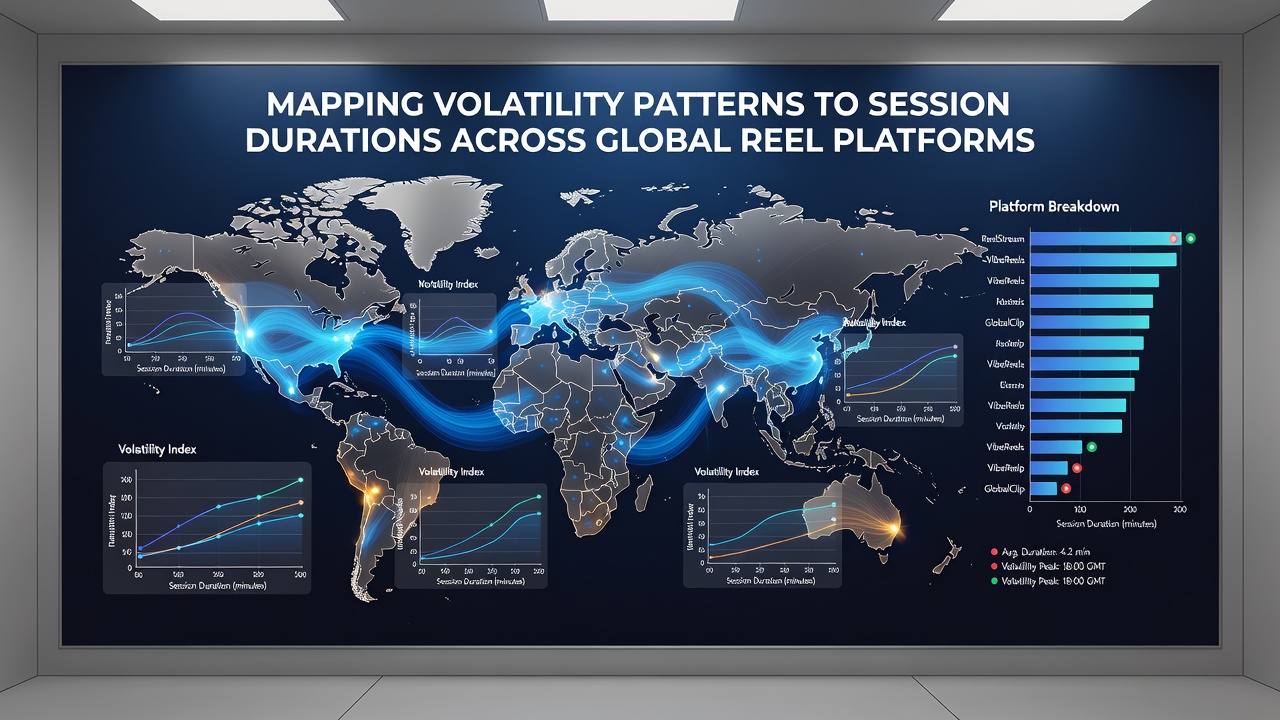
North American platforms tend to feature more medium-volatility content during peak evening periods, which correlates with sessions lasting 35 to 50 minutes on average according to aggregated industry reports. Australian operators, by contrast, show stronger representation of low-volatility titles in their popular selections, resulting in sessions that often exceed 60 minutes. These geographic differences arise from regulatory frameworks and cultural preferences that shape available game libraries.
Links between volatility and session length also appear in cross-platform comparisons where users access the same titles through different providers. Data indicates that interface variations and bonus frequency settings can modify expected duration patterns even when volatility ratings stay identical. Observers note that platforms offering quicker bonus triggers often see extended sessions across all volatility categories.
July 2026 Regulatory Updates and Platform Adjustments
Upcoming changes scheduled for July 2026 in several jurisdictions will require platforms to report volatility metrics alongside session duration statistics more transparently. These requirements aim to standardize data collection methods across borders, which should improve the accuracy of volatility-to-duration mapping in future analyses. Operators have begun preparing internal systems to comply with the new disclosure standards that take effect that month.
Industry groups such as the Responsible Gambling Council of Australia have published preliminary guidance on how volatility transparency might influence player behavior once the July 2026 rules activate. Early modeling suggests that clearer volatility labeling could lead players to select titles more deliberately, potentially shifting average session lengths in measurable ways.
Analytical Tools and Future Mapping Techniques
Advanced analytics platforms now incorporate machine learning models that predict session duration based on volatility inputs and historical player data. These tools process millions of session records to identify subtle patterns that traditional metrics overlook. Some systems already flag when a player's current session deviates from expected duration ranges for a given volatility level, allowing operators to monitor engagement trends in real time.
Academic researchers continue to refine volatility mapping methodologies through studies that combine platform data with demographic variables. Findings from one multi-country project showed that age groups respond differently to the same volatility settings, with younger players tending toward shorter sessions on high-volatility titles compared to older cohorts. Such granular insights help platforms optimize their offerings for diverse user bases.
Conclusion
Volatility patterns on global reel platforms connect directly to session duration trends through well-documented payout structures and player response mechanisms. Continued data collection across markets will strengthen these mappings, especially as July 2026 regulatory changes introduce more standardized reporting requirements. Platforms that integrate these insights into their design and analytics processes gain clearer visibility into how volatility influences engagement across different regions and user segments.